BEMRIX / TECHNICAL SEO & WEBSITE PERFORMANCE
Less to download.
More clarity at launch.
A measured improvement project on our own website: smaller image downloads, clearer page signals and a domain-ready foundation for search.
Internal improvement project · Local mobile lab tests · No public rankings or traffic claims
2,435 KB → 412 KB
Median initial-load transfer
772 KB → 253 KB
Median initial-load transfer
Pages with Open Graph titles
Across the audited 40-page snapshot
01 / THE STARTING POINT
A growing portfolio.
A heavier first load.
The site had accumulated detailed app and design case studies. Several raster previews bypassed image optimization, and every page received styles for the entire case-study collection.
The baseline crawl found descriptions and one main heading on all 40 marketing pages, but social metadata was inconsistent. There was no sitemap, robots route or shared canonical-URL policy. The business had not yet purchased its domain.
We recorded the starting source and audit reports, then worked on delivery, accessibility and launch configuration without changing the purpose of the portfolio.
02 / THE CHANGES
Fix the delivery.
Keep the work intact.
Responsive images
Raster previews now use responsive size hints and optimized delivery. Original full-resolution artwork and download links remain available.
Styles where they belong
Home and gallery pages retain shared card styling. Full case-study styling loads on project routes, instead of every marketing page.
Readable structure
Low-contrast labels were adjusted, decorative mockup headings were corrected and the work gallery gained a properly ordered section heading.
One launch configuration
Titles and social metadata use a shared policy. The confirmed domain activates canonicals, the sitemap and supported organization and breadcrumb data.
03 / THE MEASUREMENTS
Reported as measured.
Three mobile Lighthouse runs per page, before and after. Values below are the median of each metric. Lower transfer and LCP are better; higher scores are better.
| Page | Performance / 100 | LCP | Transferred | Accessibility / 100 |
|---|---|---|---|---|
| Home | 94 → 97 | 2.70 s → 2.36 s | 772 KB → 253 KB | 94 → 100 |
| Work gallery | 79 → 94 | 5.72 s → 2.95 s | 2,435 KB → 412 KB | 94 → 100 |
| TagTrack case study | 99 → 96 | 2.10 s → 2.64 s | 389 KB → 269 KB | 96 → 100 |
TagTrack is the exception: its median LCP increased from 2.10 s to 2.64 s and its performance score fell from 99 to 96, despite a smaller download. We retained that result and recommend retesting its rendering on the final host.
LCP = Largest Contentful Paint. Automated accessibility scores cover the checks Lighthouse runs; they do not certify complete accessibility. KB uses 1,000 bytes.
Home
Work gallery
TagTrack case study
Method, variability and raw evidence
Lighthouse 13.5.0, Chromium 153.0.0.0, local Next.js production builds at 127.0.0.1. Mobile emulation: 412 × 823 at 1.75 device scale; simulated 4× CPU slowdown, 150 ms RTT and 1,638.4 Kbps throughput. Each run used a fresh browser profile. Browser caches were reset; server-side image caches could remain warm. No parallel browser audits ran during measurements.
These are local lab observations, not public PageSpeed Insights or real-user field data. Source snapshots and all 18 final comparison reports are retained. An intermediate pass exposed additional heading, contrast and image-sizing issues; those were fixed before the final after series. This report page was added after the measured 40-page snapshot.
- Home: performance range 94–96 before / 93–98 after; LCP range 2.64 s–2.71 s before / 2.35 s–2.58 s after.
- Work gallery: performance range 77–91 before / 94–94 after; LCP range 3.31 s–5.78 s before / 2.95 s–3.00 s after.
- TagTrack case study: performance range 95–99 before / 96–99 after; LCP range 2.08 s–2.78 s before / 1.97 s–2.67 s after.
The website was not live. Timing can vary with the test machine, rendering and caching; lower download size does not guarantee every timing measurement improves. Test again on the chosen host and review real visitor measurements when available.
Download all before/after reports and methodology ↓04 / VISUAL VERIFICATION
The portfolio stays familiar.
The delivery changes.
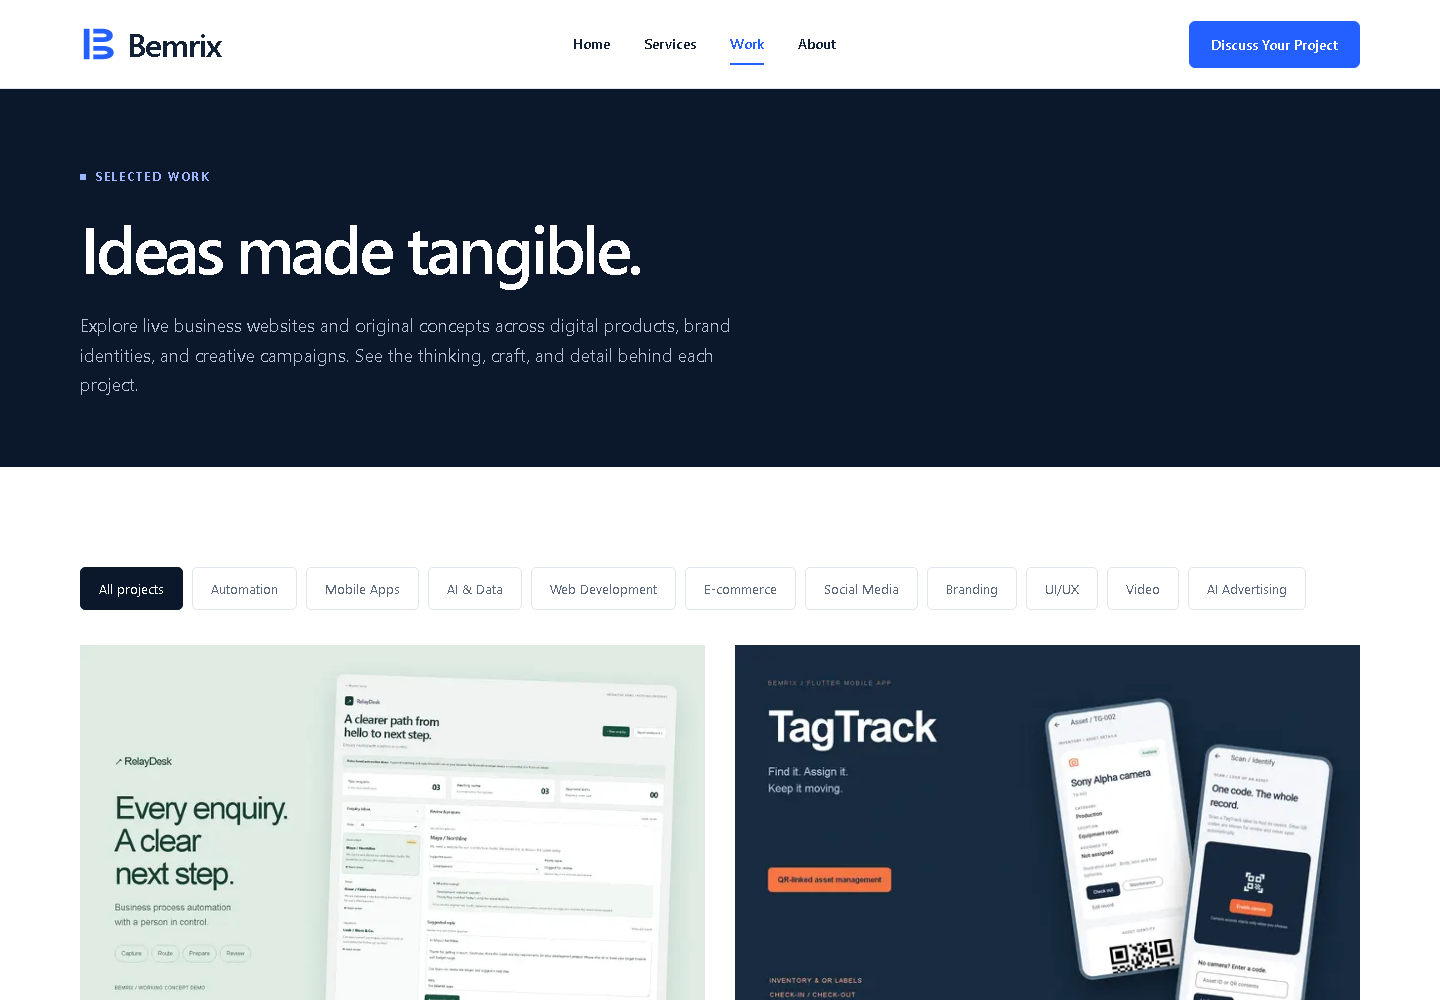
Actual desktop and phone captures after optimization. Image loading, gallery filtering, the enquiry demo and responsive layouts were checked alongside the metrics.

05 / READY FOR THE REAL DOMAIN
A clear handover.
An intentional preview.
The preview stays non-indexable. Public canonical URLs and absolute social images are withheld until the real domain is configured; the sitemap remains empty. In this preview, Lighthouse’s SEO score is reduced by the intentional indexing block.
Setting the confirmed HTTPS origin and rebuilding activates the public metadata, sitemap and organization/breadcrumb data. RelayDesk’s demo and production prompt resources remain marked noindex.
Domain purchase, hosting, Search Console verification, sitemap submission and real-user measurement remain launch tasks. No improvement in Google rankings, traffic or enquiries is claimed.
Download the launch guide ↓THE PRINCIPLE
Evidence first. Claims second.
This project demonstrates technical SEO preparation and measurable delivery improvements on our own site. The next step is to verify those foundations on the public domain and measure what real visitors experience.
Guidance: Google Search Central on canonical URLs · web.dev on lab and field measurements.
Let’s make it happen