BEMRIX / GEOSPATIAL DATA & EXPLAINABLE AI
See the patterns.
Understand the prediction.
TrafficGuard AI brings historical accident data, geographic clustering and explainable machine learning into one interactive research workspace.
Explore the experience ↓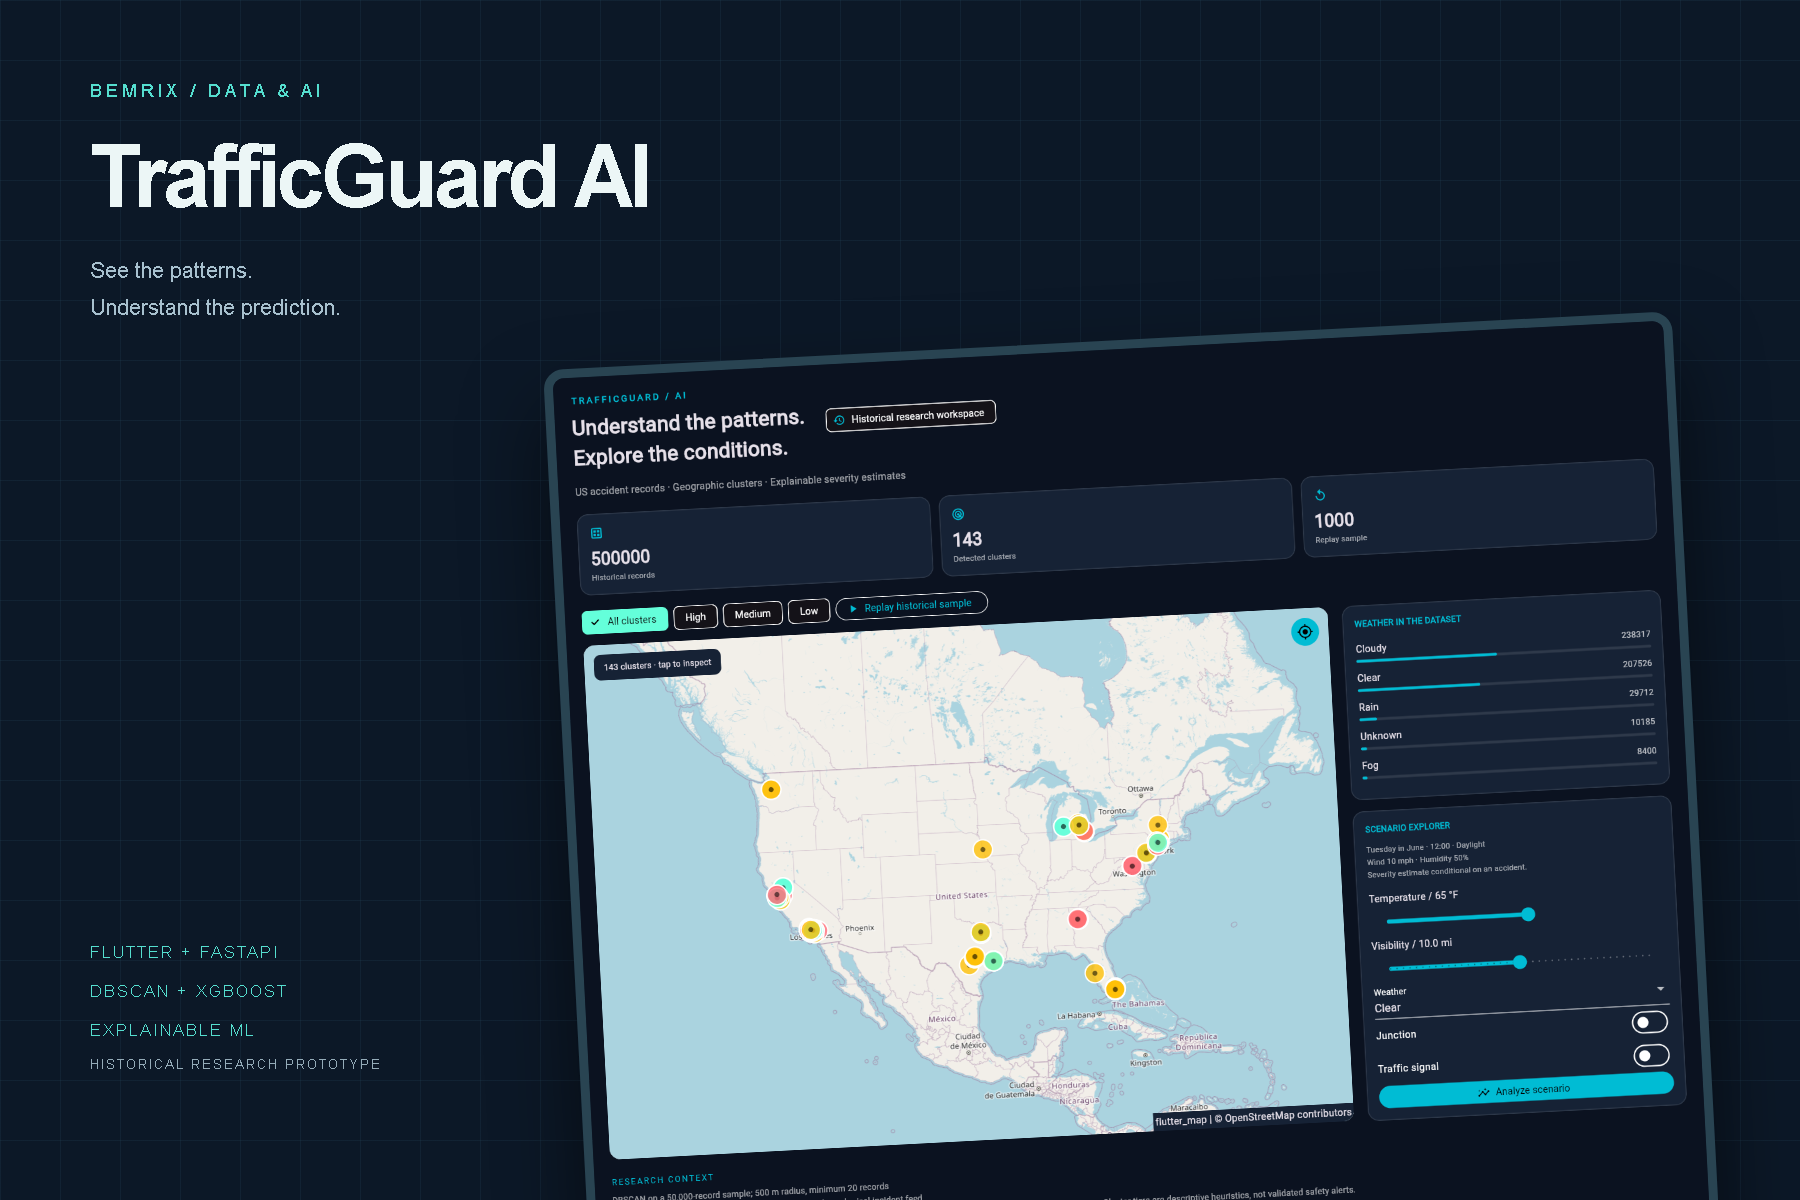
THE OPPORTUNITY
Make complex data
easier to explore.
Accident records contain geographic, weather and time-related patterns that are difficult to see in a spreadsheet. TrafficGuard connects a map, dataset summaries and a scenario explorer so those patterns can be examined together.
The project demonstrates a complete path from data preparation and spatial clustering to a Python prediction service and a responsive Flutter interface.
01 / EXPLORE THE GEOGRAPHY
A map with context.
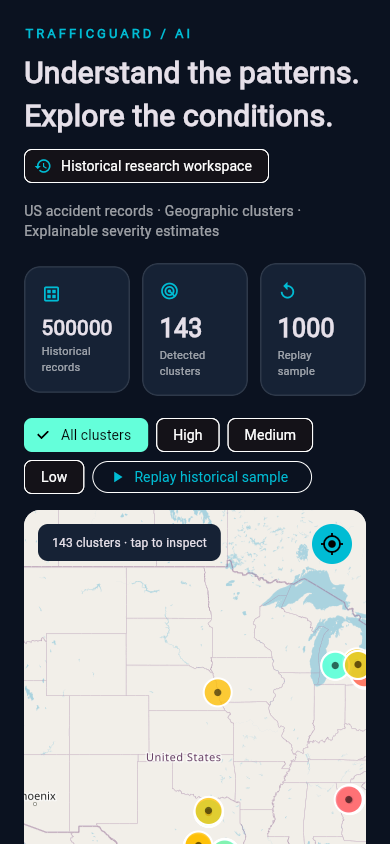
Filter clusters by their descriptive tier and select a marker to inspect record counts, average severity, peak hour and common weather. Dataset summaries show the actual records behind the workspace.
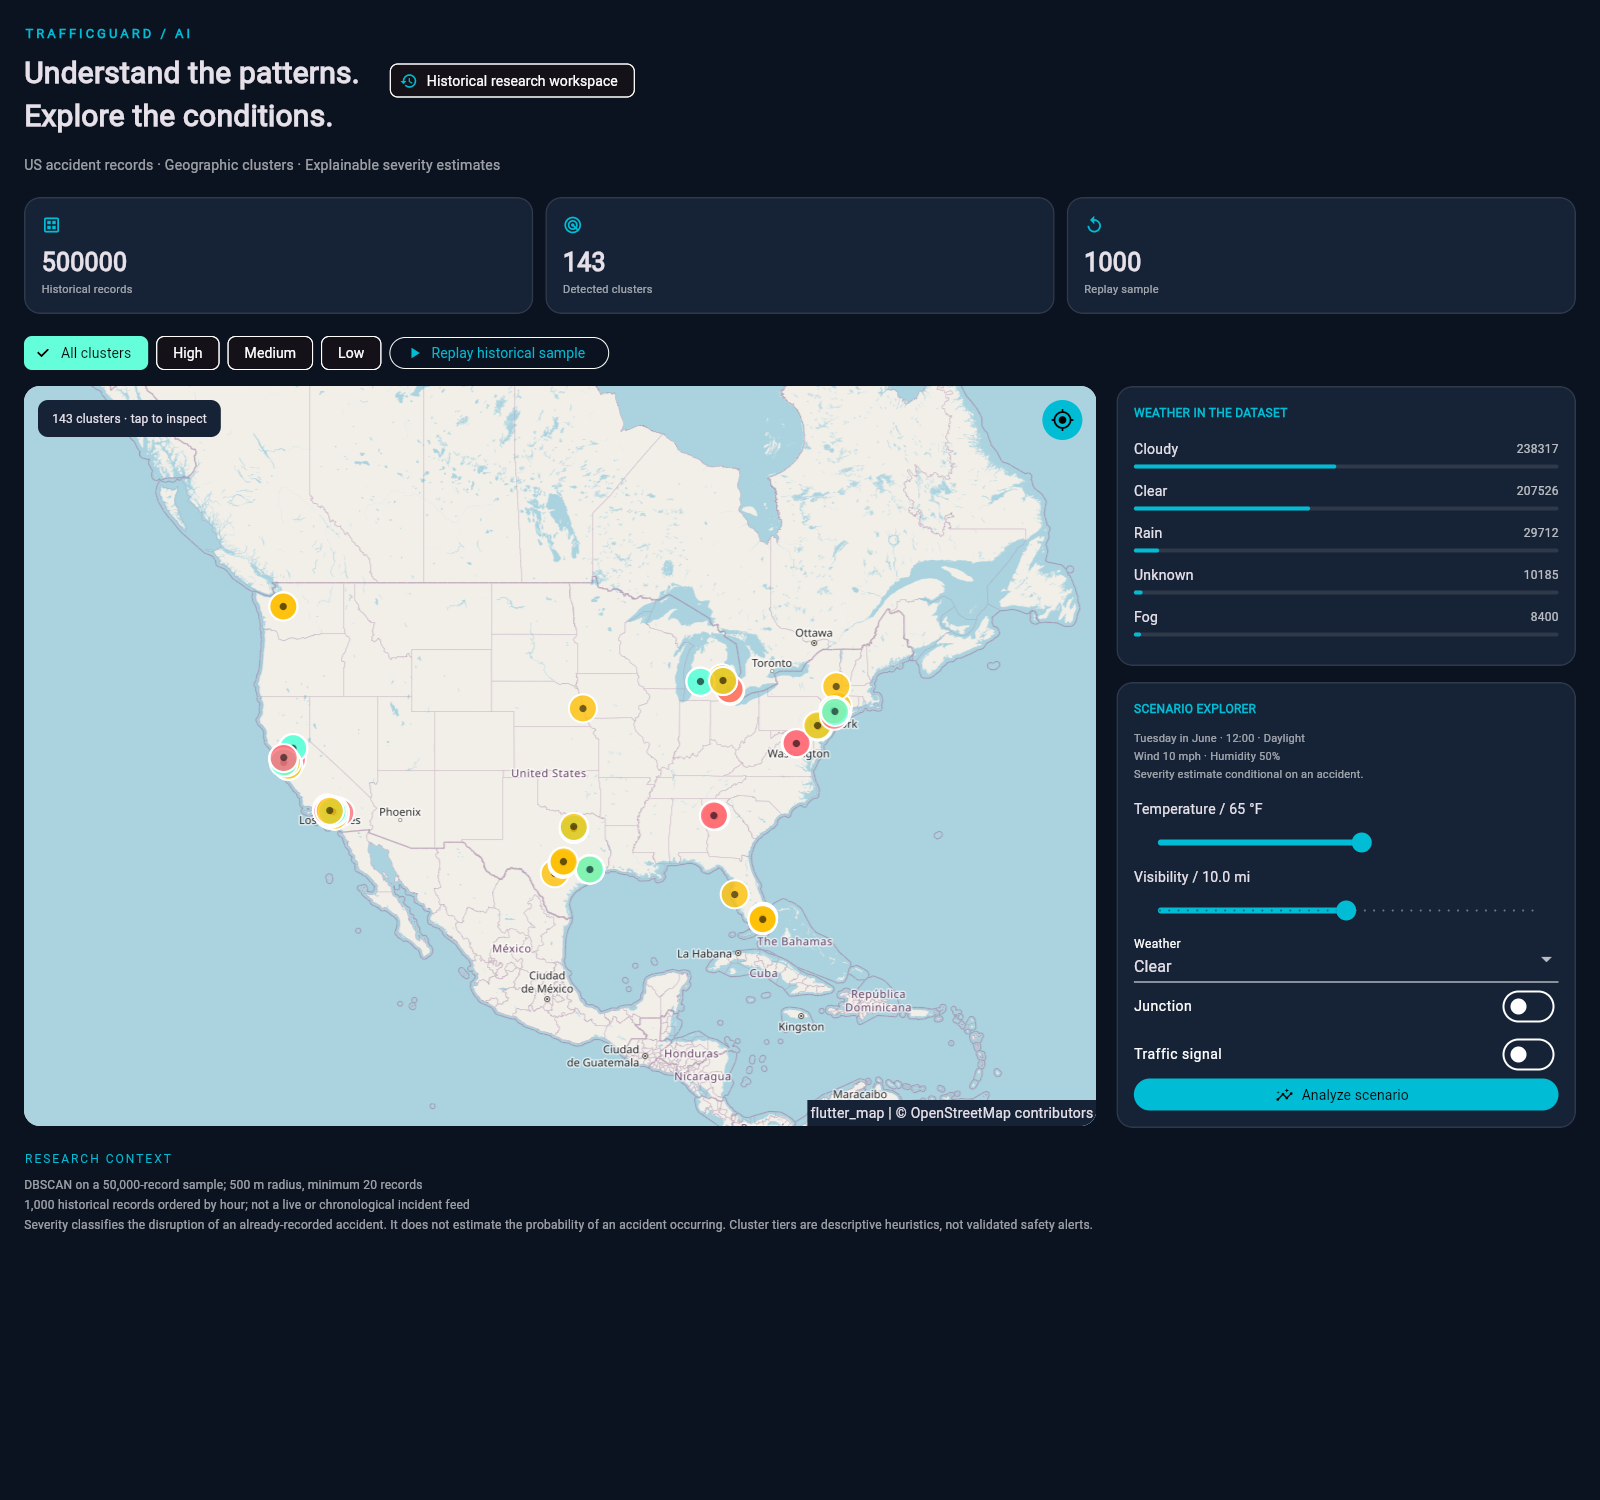
Historical traffic workspace
500,000 cleaned records, 143 stored clusters and a 1,000-record replay sample. These are local dataset counts, not live traffic measurements.
Focused exploration
High, medium and low cluster filters reduce visual noise. A selected cluster reveals its underlying summary.
Data-backed summaries
Record totals and weather distributions are calculated from the cleaned dataset instead of fixed demonstration values.
Historical replay
A start/stop control replays sampled records with a bounded marker list. The interface clearly identifies the replay as historical.
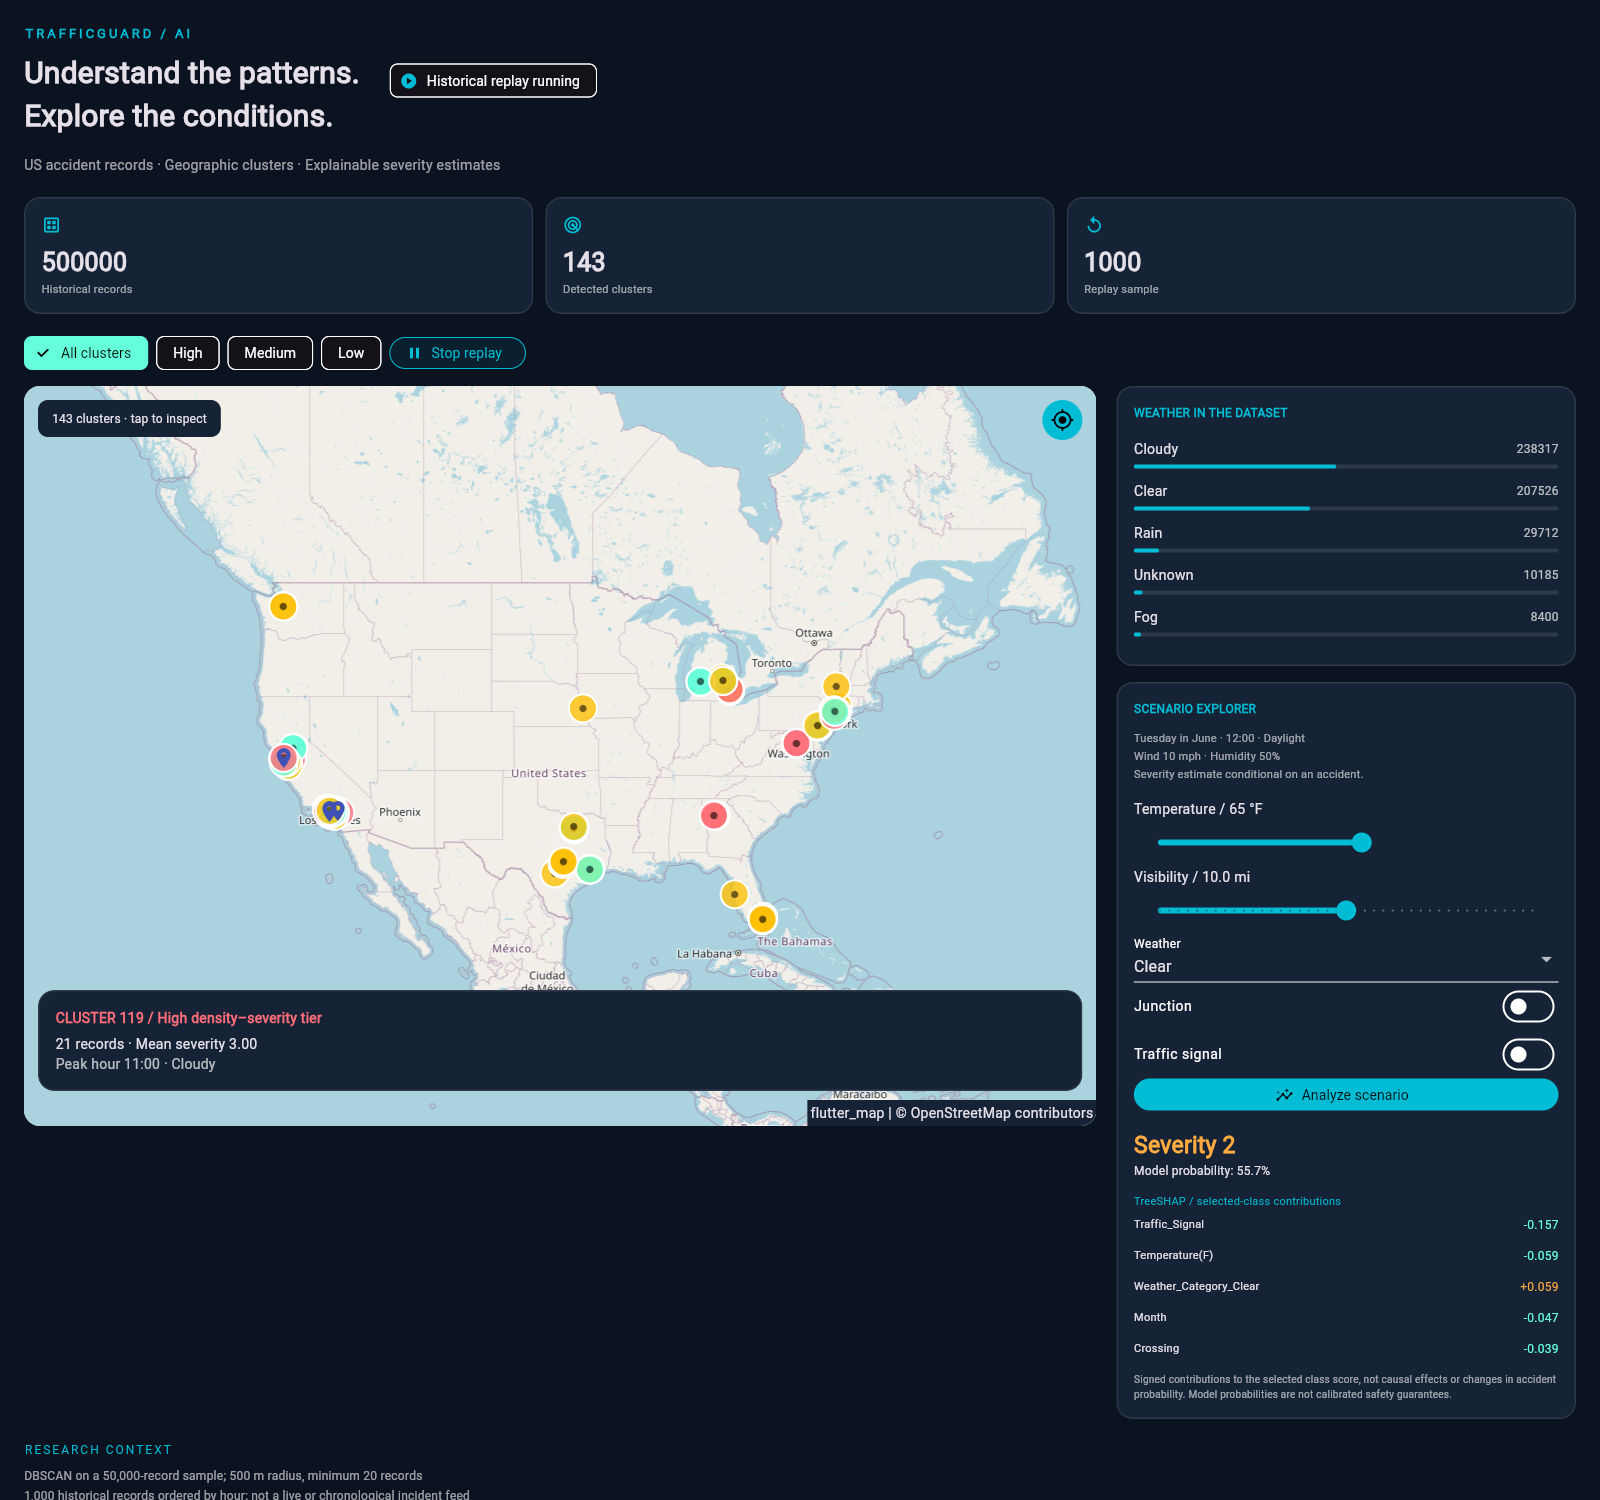
Inspect clusters and replay recorded incidents
A replay of historical samples illustrates the map interaction; it is not a live sensor feed or a chronological reconstruction.
02 / EXPLORE A SCENARIO
More than
a class label.
Change temperature, visibility, weather and road features, then request a severity estimate. The model returns a class probability and signed TreeSHAP contributions for the selected class.
The explanations come from the loaded XGBoost model. Positive and negative contributions describe its raw class score; they do not establish causes or predict the chance of an accident happening.
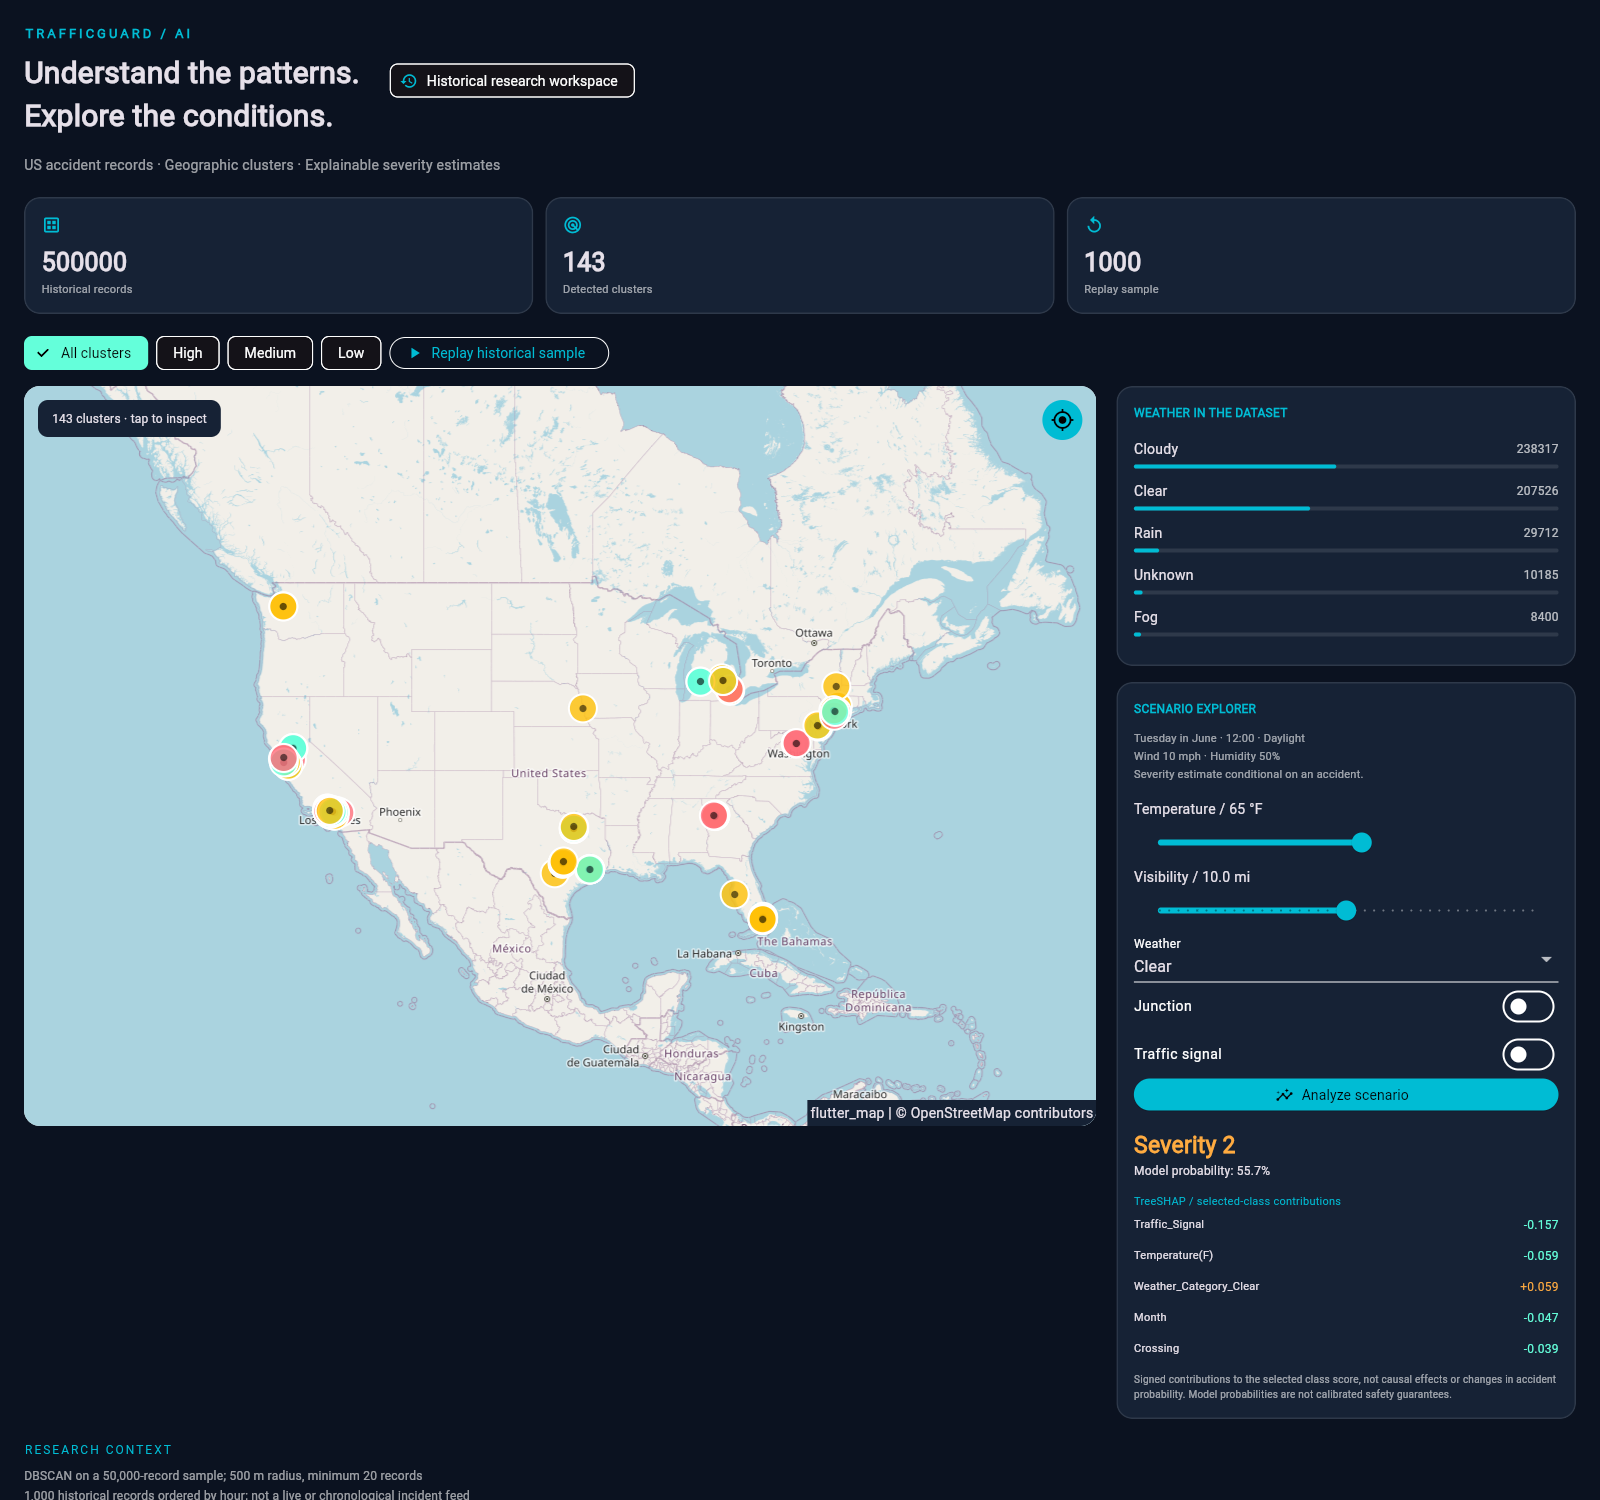
A prediction with traceable model contributions
The API returns the explanation baseline and contribution sum alongside the predicted class. Regression checks verify that they reconstruct the model’s raw score.
03 / A RESPONSIVE WORKSPACE
Useful beyond
the desktop.
The wide-screen map and analysis panels stack into a scrollable layout on smaller screens. Loading feedback, retry states and bounded requests keep the experience understandable when the backend is unavailable.
The frontend uses Provider for state management and a configurable API endpoint. Replay timers are cancelled when the workspace is disposed.
ENGINEERING IMPROVEMENTS
From demonstration
to a working showcase.
- Recovered the local Flutter source from an overly broad Git ignore rule.
- Fixed frontend/backend field aliases so scenario inputs reach the model.
- Replaced placeholder statistics, chart values and explanation factors.
- Added range validation, bounded replay requests and explicit failure states.
- Verified input aliases, invalid requests, explanation arithmetic, filtering and replay cleanup.
RESEARCH SCOPE
Clear about
what the model means.
The local pipeline uses a historical slice of the US Accidents March 2023 dataset. DBSCAN operates on a 50,000-record sample with a 500-metre neighbourhood and a minimum of 20 samples. Cluster tiers combine count and mean severity using a heuristic.
Existing training artifacts report approximately 66.2% accuracy and 0.633 weighted F1 for XGBoost on the project’s random holdout split. These are recorded experiment results, not a fresh independent evaluation or evidence of real-world safety performance.
This portfolio presents a research prototype. Temporal and geographic validation, probability calibration, dataset licensing review and production operations remain release work. The model estimates severity conditional on an accident; it does not forecast whether one will occur.
Map data © OpenStreetMap contributors. Captures show the running local application.
BUILD WITH BEMRIX
Turn your data
into a useful product.
Planning an analytics dashboard, mapping tool or AI-assisted workflow?
Discuss your project ↗